Hello, we are Deex Korea.
It seems that the season and work are getting lively as May comes.
Learn Power BI, and increase work efficiency with Deex Korea.
Don’t you think data analysis or data visualization is just confusing and difficult?
Is it necessary for data experts to analyze data about work?
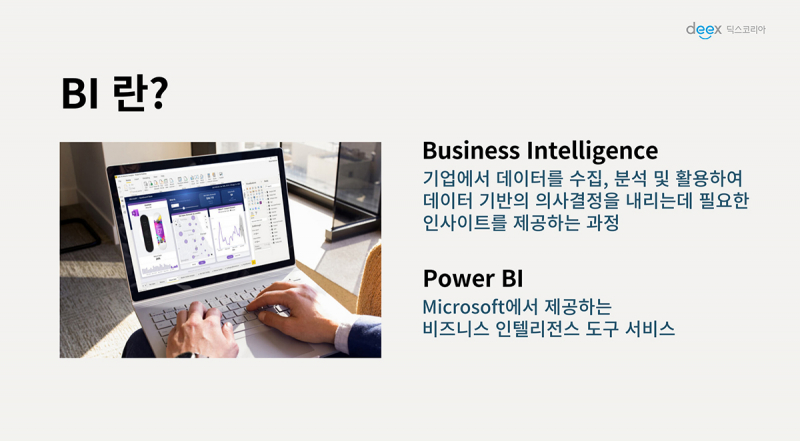
Power BI on the Power Platform makes it easy for anyone to visualize their data as if they were making a presentation with PowerPoint.
Power BI – Data Visualization Tool

What’s the difference between a large company making a data report for reporting to the top and an individual making a data report for the business?
There are differences in detail and format, but the essence of making decisions based on data does not change.
Visualizing the data may be nothing more than drawing a graph.
However, viewing data in a new format suggests the possibility of gaining new insights.
It’s good to conveniently receive reports from others, but analyze and gauge the data from your own perspective.
Why does data analysis require data preprocessing?
Data preprocessing is like flattening the floor before laying the floor.
Data from various sources are often of different sizes and types.
Such uneven data cannot be associated with other data because it cannot be used as a reference point for the analysis.
You need to refine the data and put it at the same starting point to see what data is bigger or smaller, right?
You can download the data used in the video from the link below.
Download Naver Keyword Advertising Results Data >> >>
The password is in the video, so please check the video as well!
In the webinar in June of Deex Korea, we will draw a report using the processed data.
Please look forward to the next webinar.
Deex Korea as a Microsoft Business Solutions Partner
Provides Microsoft 365 business license proposal, development, and training.
DEEX Channel